Namely Analytics Attrition Dashboard
Attrition Dashboard
Use the Attrition dashboard to track trends in employee turnover. You can view trends by year, month, and termination reason, and apply filters to further drill down on your attrition data.
For more information on using Namely Analytics dashboards, including how to select filters and download reports, see Namely Analytics.
Attrition by Month
The Attrition by Month graph displays monthly terminated employees as a percentage of your organization’s total headcount.
The graph aligns with SHRM standards where attrition by month is calculated using the following formula:
-
(total number of employees terminated in a month /average number of active employees in the month) *100
The average number of active employees in a month is:
-
(number of employees at the end of the previous month +number of employees at the end of the selected month)/ two
An active employee is defined as one with a Start Date equal or prior to the last day of the month and with no termination date. The employee status in HCM (active, inactive, pending) is not taken into account for the purposes of this graph.
Note:
-
If you apply a filter, it will apply only to the terminated employees, not active employees.

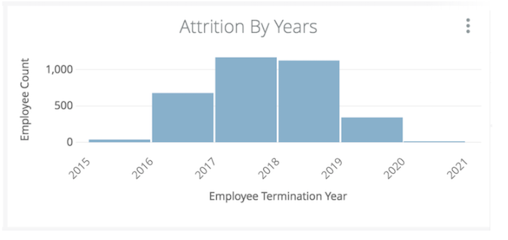
Attrition by Year
The Attrition by Year graph displays the actual count of terminated employees by year. This graph displays all terminations and does not respect the Termination Date filter (which defaults to the last 12 months).

If you want the Data Table to match the Attrition by Year graph, change the Termination Date filter to is any time
.
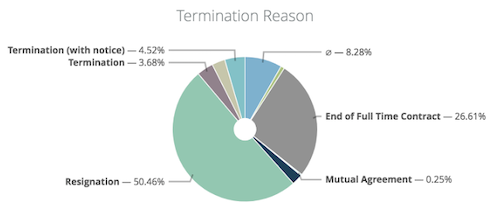
Termination Reason
The Termination Reason chart displays all termination reason data in a pie chart.
If your termination reasons in HCM contain voluntary or involuntary tags—such as (v) for voluntary or (i) for involuntary—you can use the Termination Reasons > contains filter to display only voluntary or involuntary departures.
For more information on updating your Termination Reasons, see Employee Data Settings: Termination Reason.

Attrition Data Table
Tenure (in years) is a calculated field within Namely Analytics. Tenure displayed is as of the current, selected, or departure date, not the tenure on the employee's next anniversary.
In the Attrition dashboard, tenure is calculated by taking the difference in an employee's start date and termination date in days, divided by 365.25. This calculation is to account for leap years.
